
Pictures Help to Tell the True Economic & Investment Story
Sometimes a picture can tell a thousand stories. However, I hope to use far fewer words and utilize only three pictures (graphs actually) in which to explain the story behind the price declines within the U.S. equity markets. Let’s begin with the two graphs below which from my viewpoint tells of the correlation between the drop in equity prices over the past 6 weeks and the continued deterioration in earnings per share estimates.The first chart from Business Insider demonstrates how 2015 equity prices and Q4 earning per share estimates were moving apart during Q4 2015.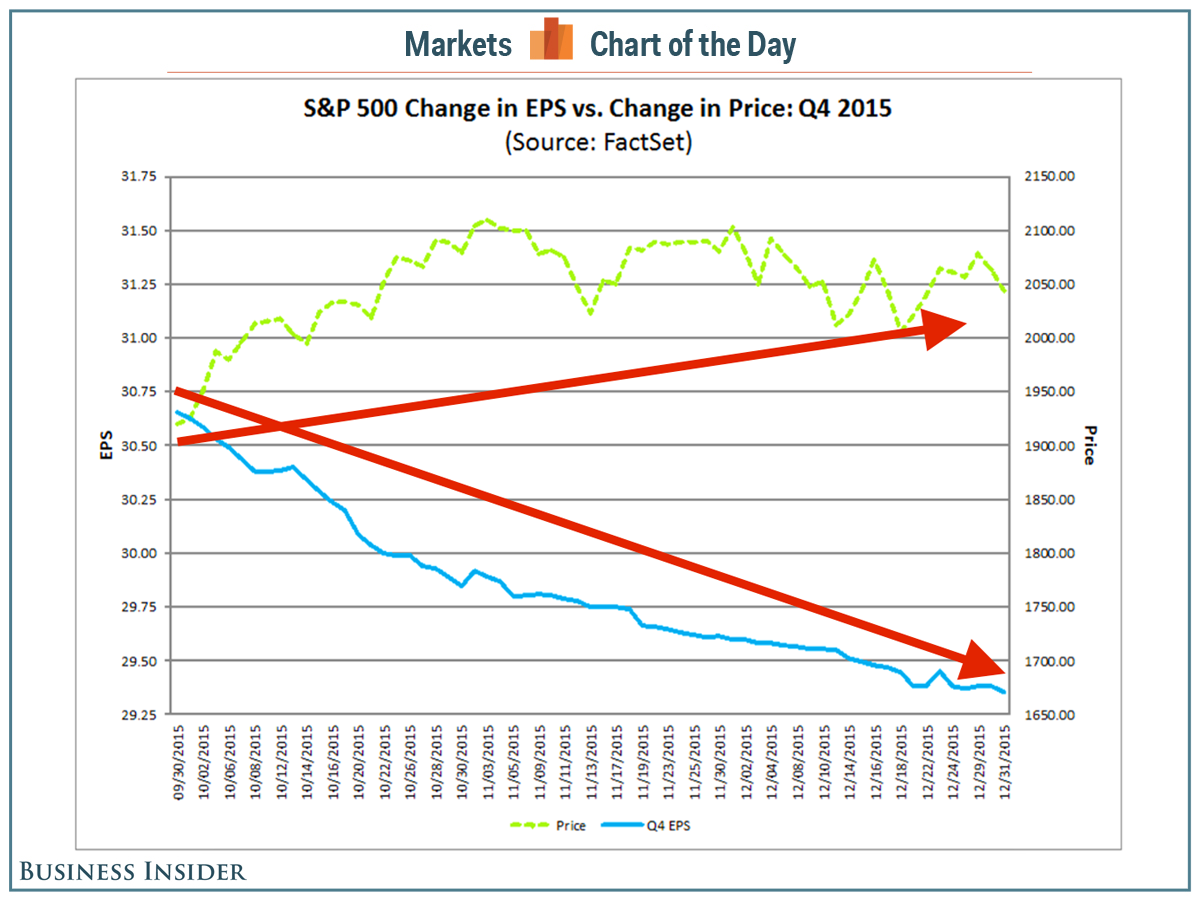 The second chart, compliments of The Earning Scout, shows the drastic slide by month beginning in July 2015 of Q4 earnings estimates.
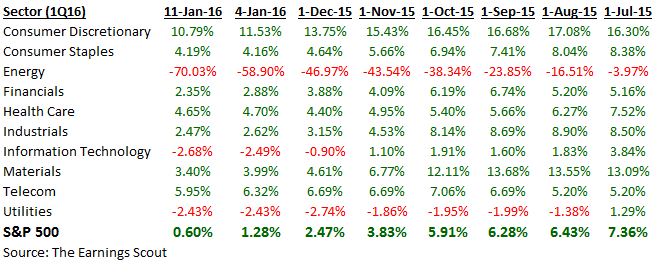 According to these two charts, we could have seen going back to the early Fall of 2015 timeframe that something was amiss within the fundamentals of the biggest U.S. Companies and the prices that they were trading at. The right call at that time would have been to underweight equities and overweight cash or bonds which is precisely what we did at TAMMA Capital.But what are the driving forces (or noise in my opinion) behind expert’s explanations of why equity prices have dropped so far this year? A decline in oil prices and an economic slowdown in China. Let’s take a closer look at each individually starting with oil to determine if either are a driving force or just market noise.
The Decline in Oil Prices
- While consumers are benefiting greatly from the drop in oil prices (it is estimated that consumers are saving $80M per day) oil companies that spent big money in capital projects years ago to bring on new capacity and build new pipelines when oil was near or over $100 per barrel are definitely hurting right now. Economics would tell us that there are winners and losers in this game, but is this current situation a net positive or negative for the existing economy? I am not sure if anyone really knows the answer to this question. Regardless of the answer, my job as an asset manager is to determine who those winners and losers are and invest accordingly.
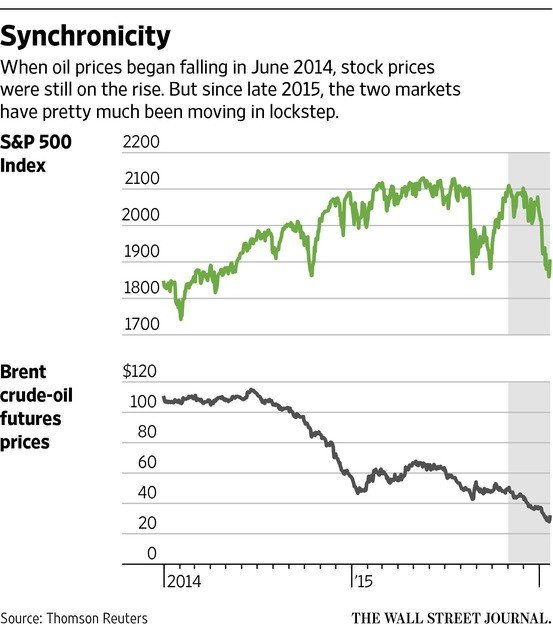
- With the graph below, you can see that as the price of crude oil began to drop, equity prices did not. The drop in oil prices were likely due to a decline in demand which also began showing up in U.S. companies revenue and earnings estimates. This chart is another illustration of how the correction of equity prices downward is beginning to catch up with the downward revision in both revenues and earnings per share.
Economic Slowdown in China
- The drop in crude oil prices probably has some direct correlation with the slowdown in the Chinese economy. However, as I have listened to reports from Bloomberg over the past few weeks, China has potentially begun to stockpile tankers full of crude oil in order to take advantage of this dramatic decline in crude oil prices. If this is indeed the case, this type of situation could give a false sense of what the actual price of a barrel of crude should be. If Chinese interactions such as this were occurring, it would make the price of crude oil artificially high.
- While the slowing China economy could be a reason why oil has fallen, it should not be having a material impact upon the U.S. economy. According to Howard Marks at Oaktree Capital, “China doesn't play a pivotal role in the U.S. economy (other than as a provider of finished goods). It is estimated to account for only 1% of the combined profits of the S&P 500 companies. Exports account for about 13% of U.S. GDP, and in the first eleven months of 2015 less than 8% of our exported goods went to China ($106 billion of goods, versus an annual GDP approaching $18 trillion – again, well below 1%)."
As we have noted in previous articles, we believe that there are several reasons as to why revenue and earnings estimates have slowed which include the following;
- Consumers are saving more, this could be for a variety of reasons which could include, paying down debt, increase retirement savings, or increase overall savings for emergency purposes. People may still be planning for an uptick in oil prices and have taken up alternative savings measures to take advantage of the drop in gasoline prices.
- Although the government CPI data shows little to no inflation, there are pockets of the economy that are increasing their prices. We see inflation in both the education and health care sectors. As we pointed out earlier there will always be winners and losers within the ever-changing economic landscape.
So at the end of the day, we are back to focusing on the continued deterioration of revenue and earnings estimates by U.S. companies. By understanding some of the underlying trends within the various sectors that make up the U.S. economy, we can carefully try to identify those potential winners while trying to avoid the potential losers.